The Aluminum Can Advantage
Key Sustainability Performance Indicators for the Aluminum Can
Aluminum cans are the most sustainable beverage package on virtually every measure. Our annual key performance indicator report shows how aluminum cans stack up against the competition.
The Most Sustainable Beverage Package
Note: In recent months, the Aluminum Association has identified significant anomalies in key Census Bureau data that appear to be artificially inflating the aluminum beverage can recycling rate. As a result, the association has not released a new recycling rate/key performance indicator report since 2021 (2020 recycling rate) while we work with the government to review and update the data. We hope to resolve this issue in the coming months and report several years of recycling rates in 2024.
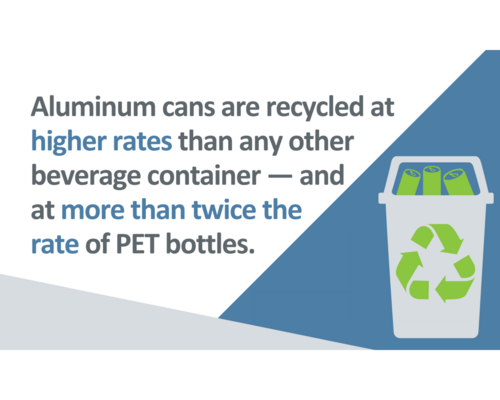
Aluminum cans are the most sustainable beverage package on virtually every measure. Aluminum cans have a higher recycling rate and more recycled content than competing package types. They are lightweight, stackable and strong, allowing brands to package and transport more beverages using less material. And aluminum cans are far more valuable than glass or plastic, helping make municipal recycling programs financially viable and effectively subsidizing the recycling of less valuable materials in the bin.
Most of all, aluminum cans are most often recycled over and over again in a truly circular, closed loop recycling process. When recycled, glass and plastic are often turned into a into a different product that is not recyclable or is unlikely to be recycled again. For example, a PET bottle might end up as carpet fiber or a t-shirt. Aluminum cans, meanwhile, can be recycled infinitely to make new cans.
The Aluminum Association and the Can Manufacturers Institute produce an annual report highlighting these and other key performance indicators (KPI) for the aluminum can compared to competing packaging types.
U.S. Aluminum Can Recycling Counter
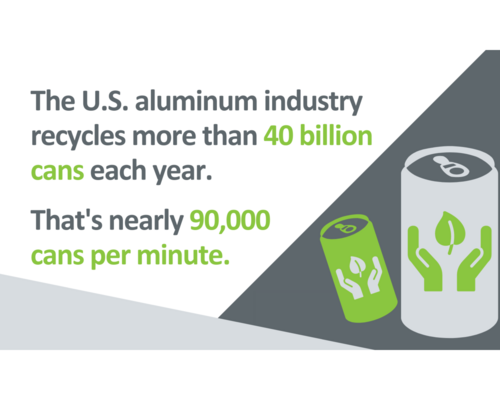
Each year, the U.S. aluminum industry recycles billions of used aluminum beverage cans. In fact, since the industry starting tracking recycling in 1972, we've recycled more than 2 trillion cans. Here's how many cans we've recycled so far this year.
Aluminum Beverage Can KPIs
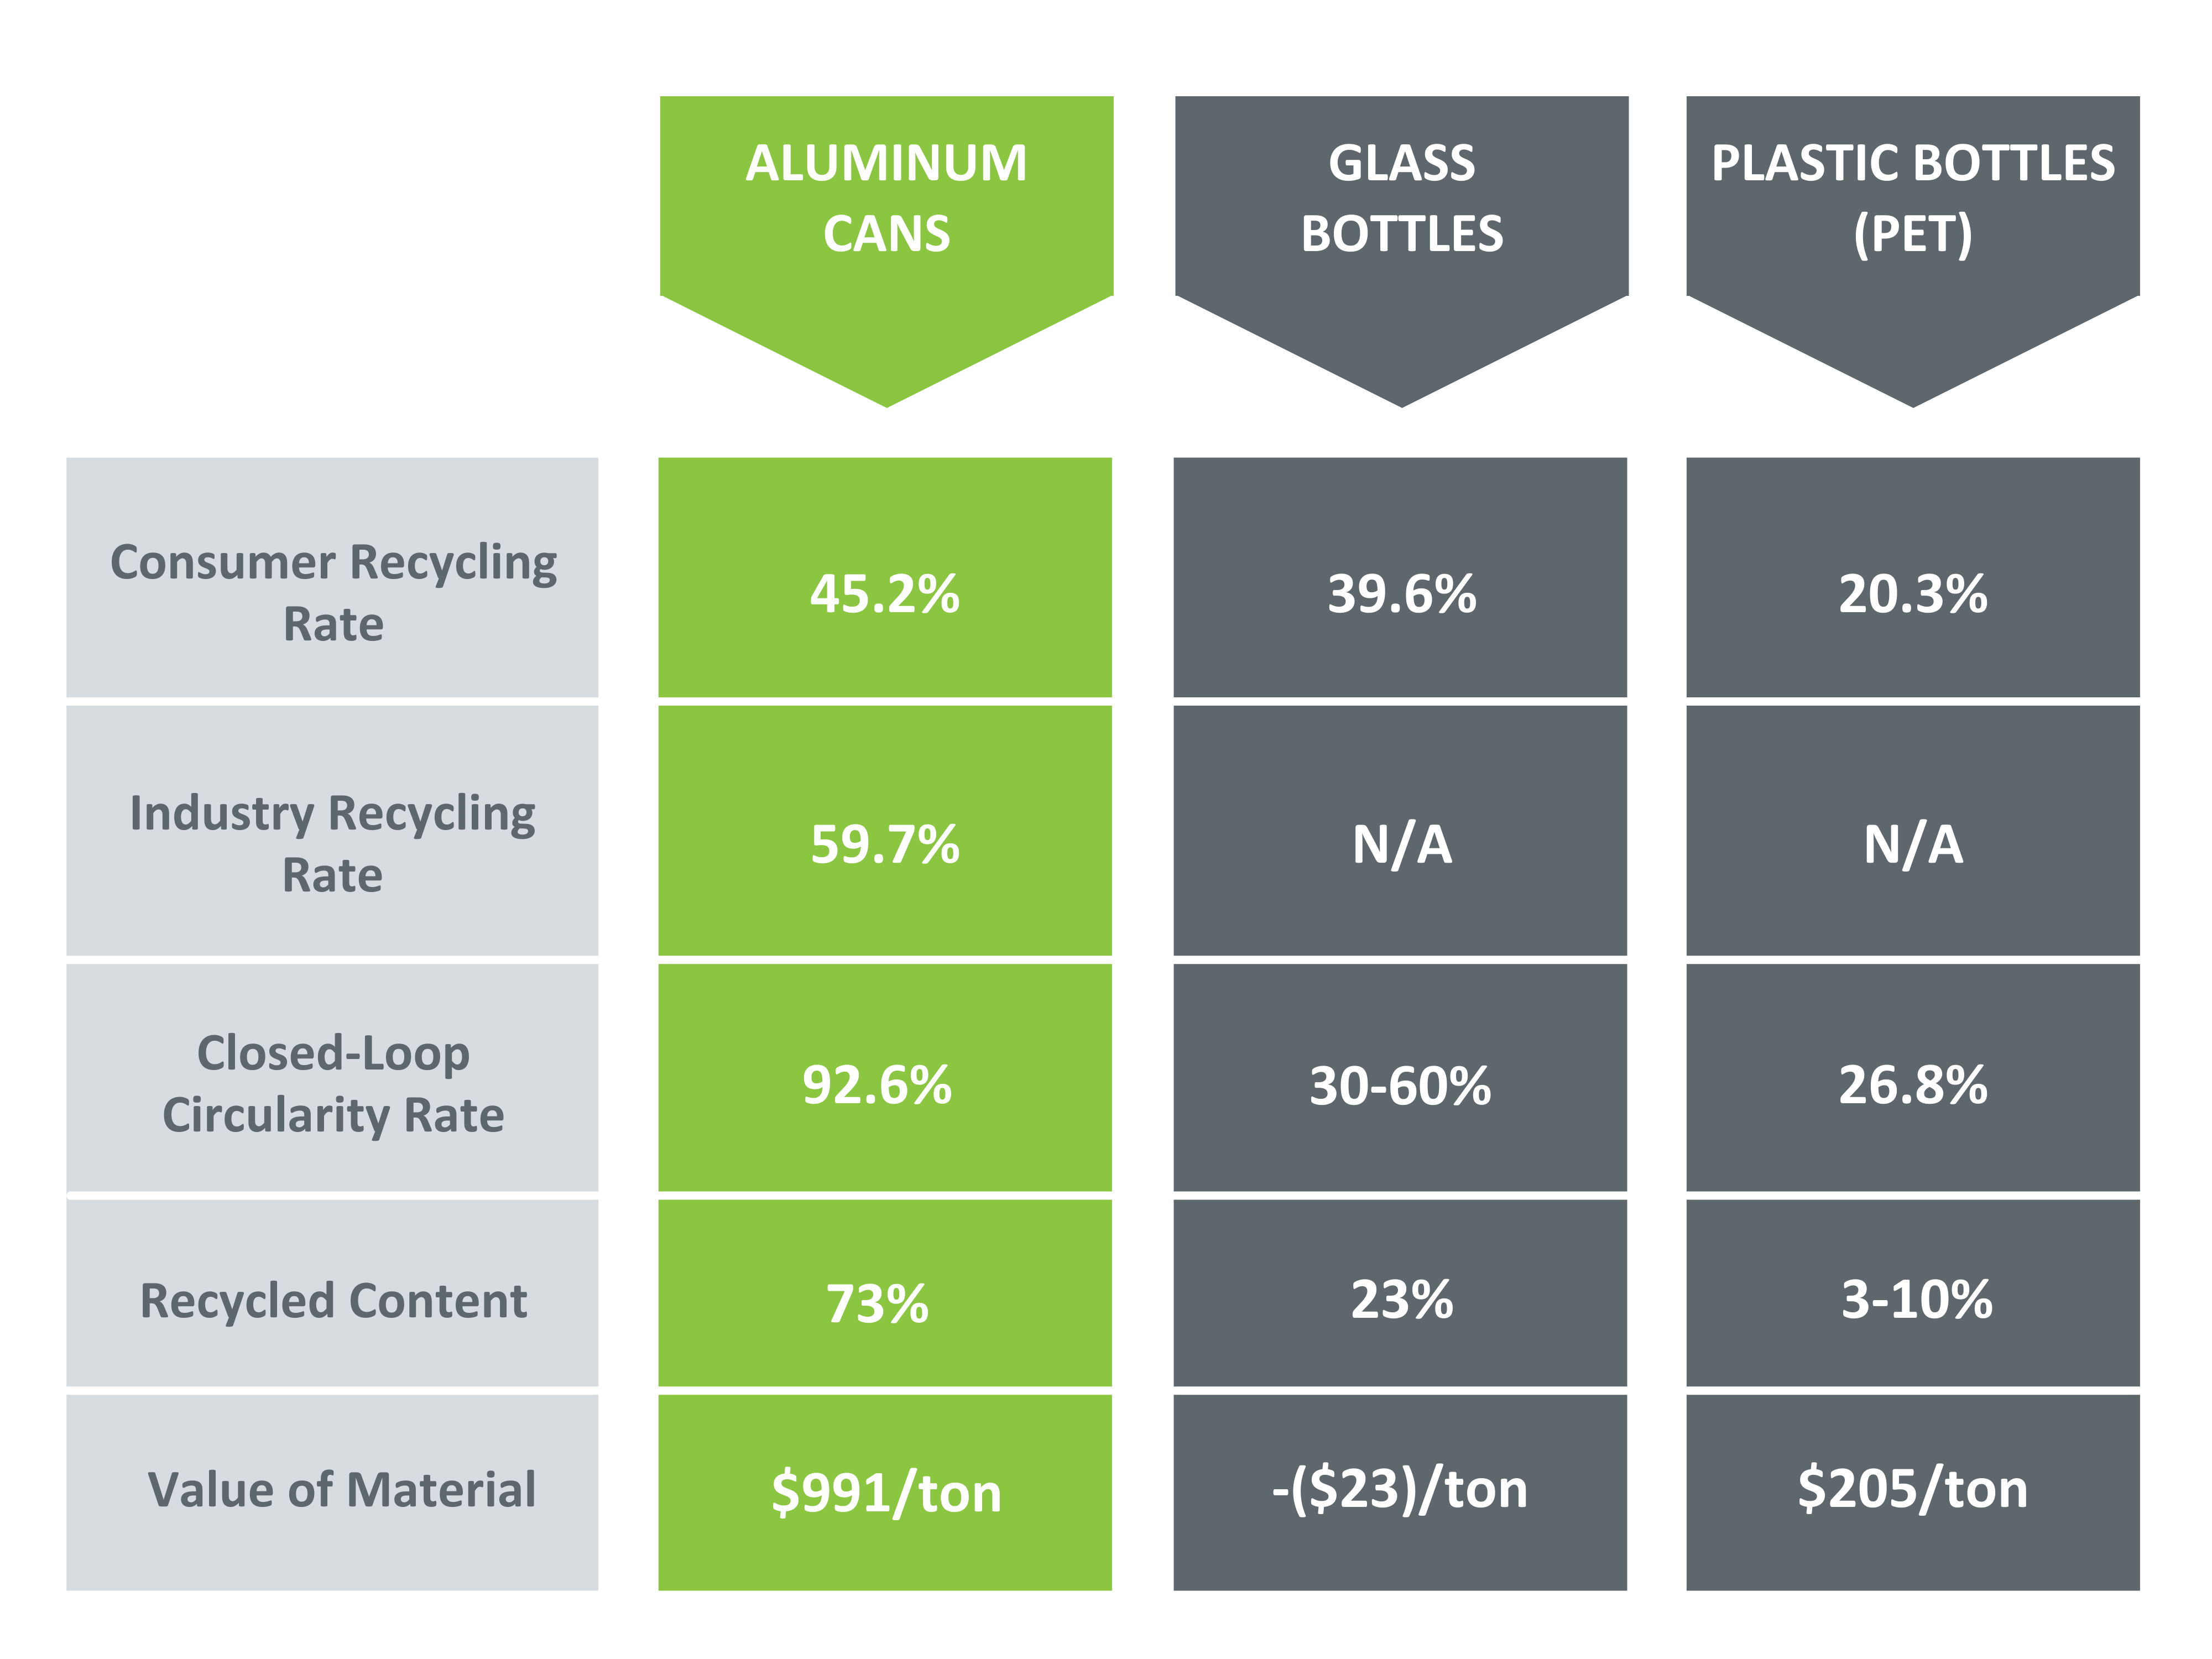
Consumer Recycling Rate
This rate measures the amount of aluminum can scrap recycled domestically as a percentage of cans available for recycling in the United States. A snapshot of consumer recycling behavior, it also captures how well municipal recycling programs are performing nationally. This rate reflects the amount of aluminum can scrap melted for recycling so is a true reflection of actual can recycling, similar to the "net recycling rate" reported by other beverage container industry groups.
Industry Recycling Rate
This rate measures the amount of used aluminum can scrap recycled (melted to make new products) by U.S. aluminum producers as a percentage of cans shipped. An indicator of industry stewardship of the metal, this rate includes both domestic and imported can scrap from foreign countries that is reclaimed by U.S. producers as well as used cans that are exported and recycled overseas. This rate has risen dramatically since it was first reported in 1972 at 15.4 percent.
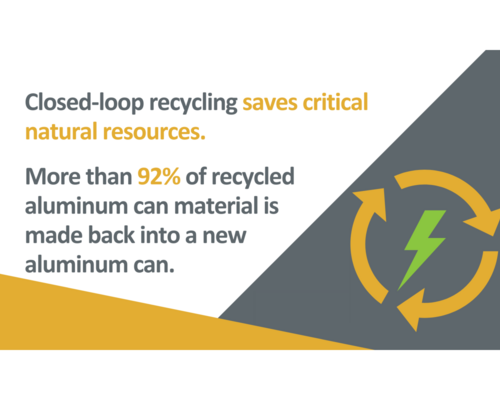
Closed-Loop Circularity Rate
Introduced in 2021, this KPI measures the percentage of recycled material used to go back into the same product – in this case a new beverage container. When products are recycled, the recovered materials can be used to make the same (closed-loop recycling) or a different and sometimes lower grade product (open-loop recycling). Closed-loop recycling is preferred because the recycled product maintains its original quality and the process can be repeated infinitely. In contrast, open-loop recycling can lead to compromised material quality and can often only happen a single time.
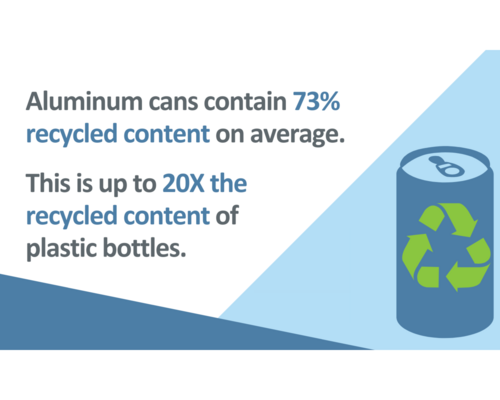
Recycled Content
This KPI measures the proportion of recycled versus virgin material in the average beverage container. High recovery rates for aluminum, along with the closed loop nature of can recycling, drives a large amount of recycled content in the average aluminum can, in notable contrast to glass and PET bottles. Since it takes only around 5 percent of the energy to produce aluminum from recycled material versus producing new aluminum, high recycled content is a good indicator of the can’s environmental footprint. The recycled content calculation includes metal from both post-consumer and post-industrial scrap sources and complies with ISO reporting standards.
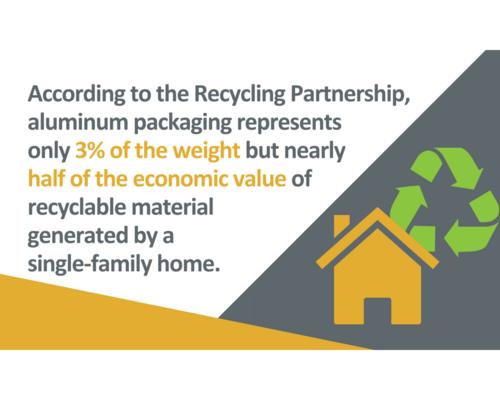
Value of Material
This KPI measures the dollar value per ton of aluminum can scrap. Aluminum cans help to make municipal recycling programs possible. Many such programs rely on re-selling recycled material to stay financially viable and the high value of aluminum in the recycling stream effectively subsidizes the recycling of less valuable materials in the bin. This measure indicates the relative importance of different types of beverage container to sustaining the financial viability of municipal recycling programs. The data is based on a two-year rolling average of relevant scrap commodity prices.
Closing the Can Recycling Loop
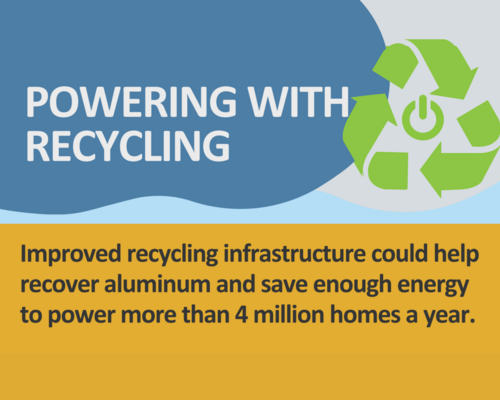
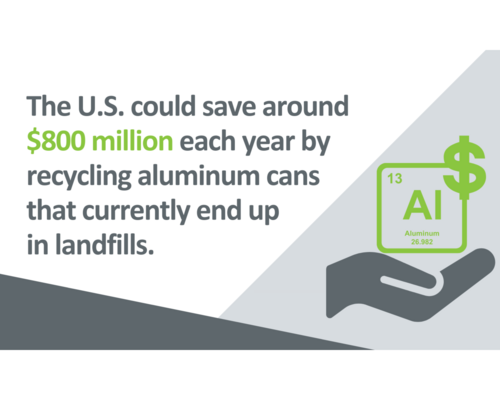
Each year, every American sends nearly a dozen 12-packs worth of aluminum beverage cans to landfills instead of the recycling bin on average. This is a massive loss to both the environment and the economy. In fact, by recycling all the aluminum beverage cans that currently end up in U.S. landfills each year, we could save around $800 million for the economy and enough energy to power more than 2 million homes for a full year. The Aluminum Association is working on a number of fronts to grow aluminum can recycling in the United States today.
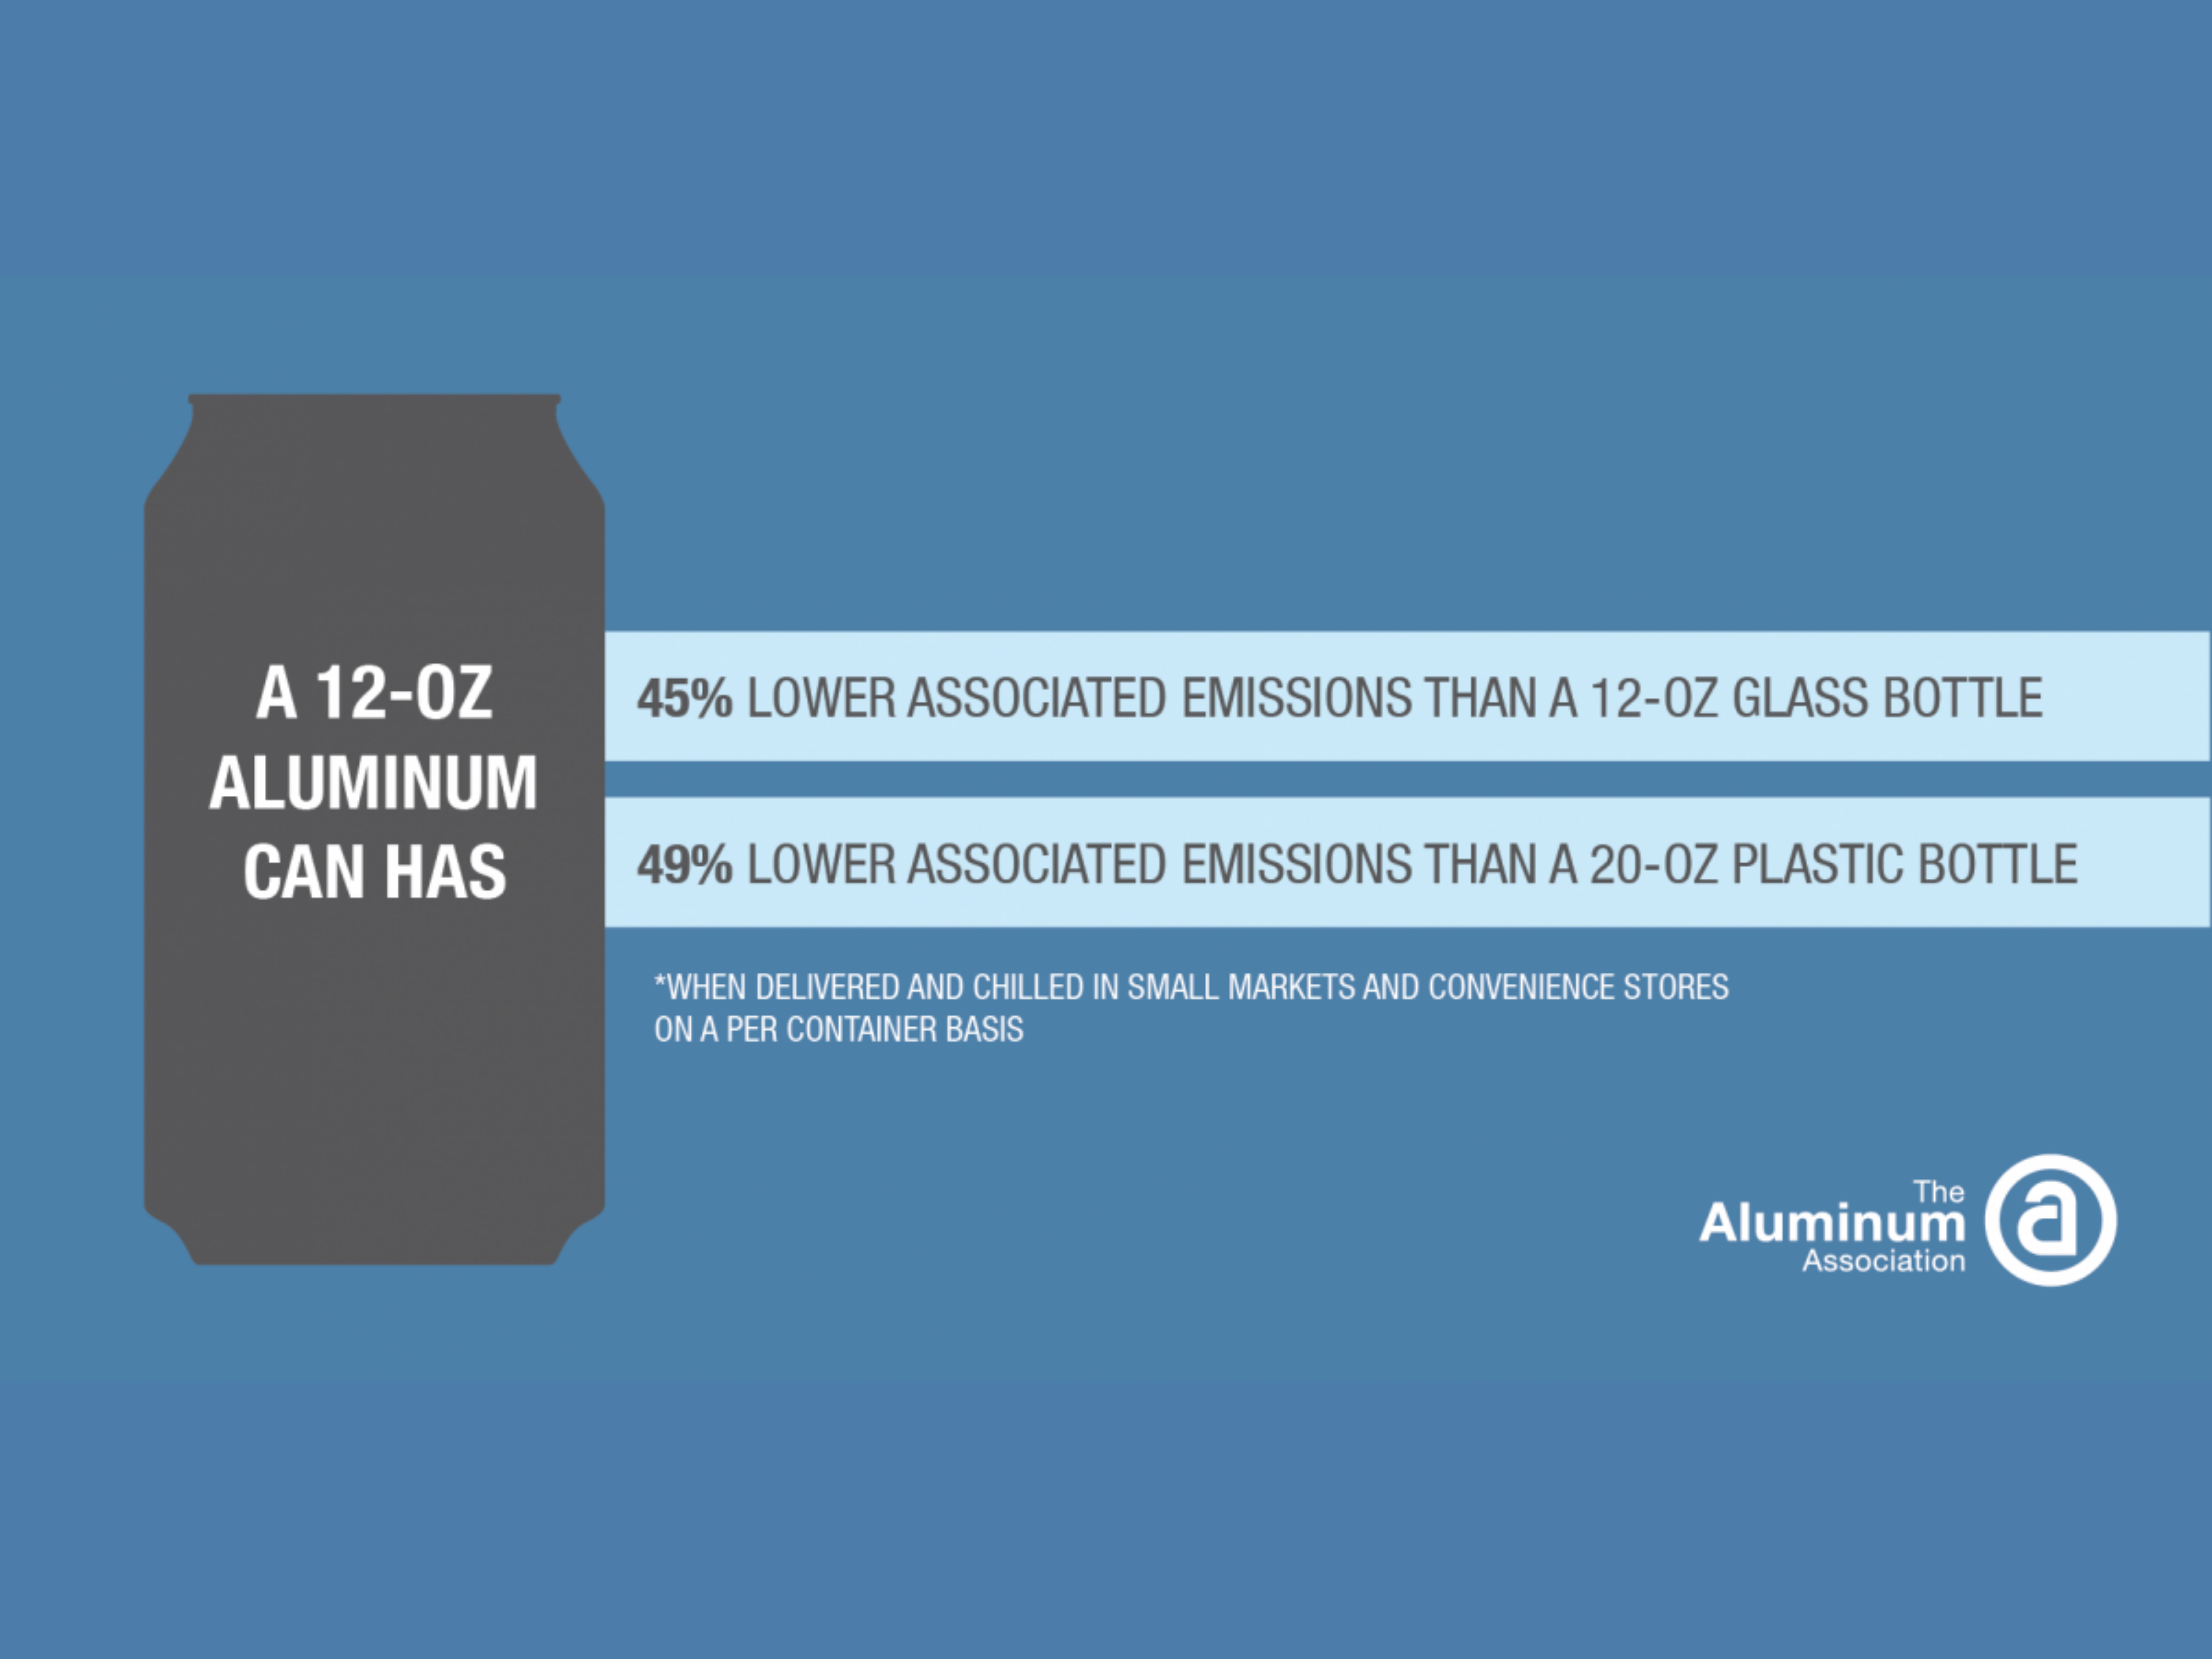
Cans Top on Transportation & Refrigeration
A 2016 study by ICF International found that the combined greenhouse gas (GHG) emissions associated with the transportation and refrigeration of beverages in aluminum cans are lower than those associated with beverages in glass or plastic bottles under the same conditions.
On a per liter beverage basis, emissions associated with transporting and cooling aluminum cans are 7 to 21% lower than plastic bottles and 35 to 49% lower than glass bottles. Noted Marian Van Pelt, Vice President at ICF International: “Across all scenarios studied, aluminum has lower associated use-phase emissions than comparable glass or plastic containers.”
U.S. Aluminum is Working to Grow Recycling
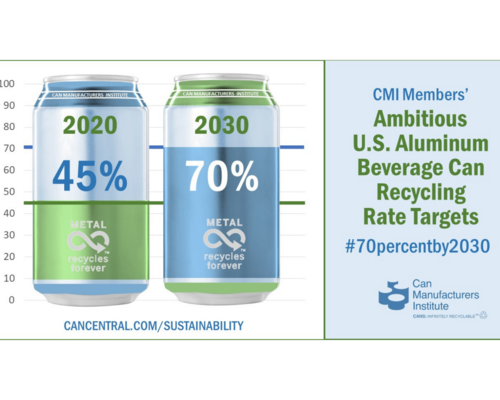
The aluminum industry supports the Can Manufacturers Institute's aluminum can recycling rate goal of 70% by 2030
Learn More